
Why Historical Machine Data Matters
Transform past operating signals into valuable context for predictive maintenance, condition monitoring, and intelligent production decisions.
Amine Ben Salem
Industrial Automation Lead
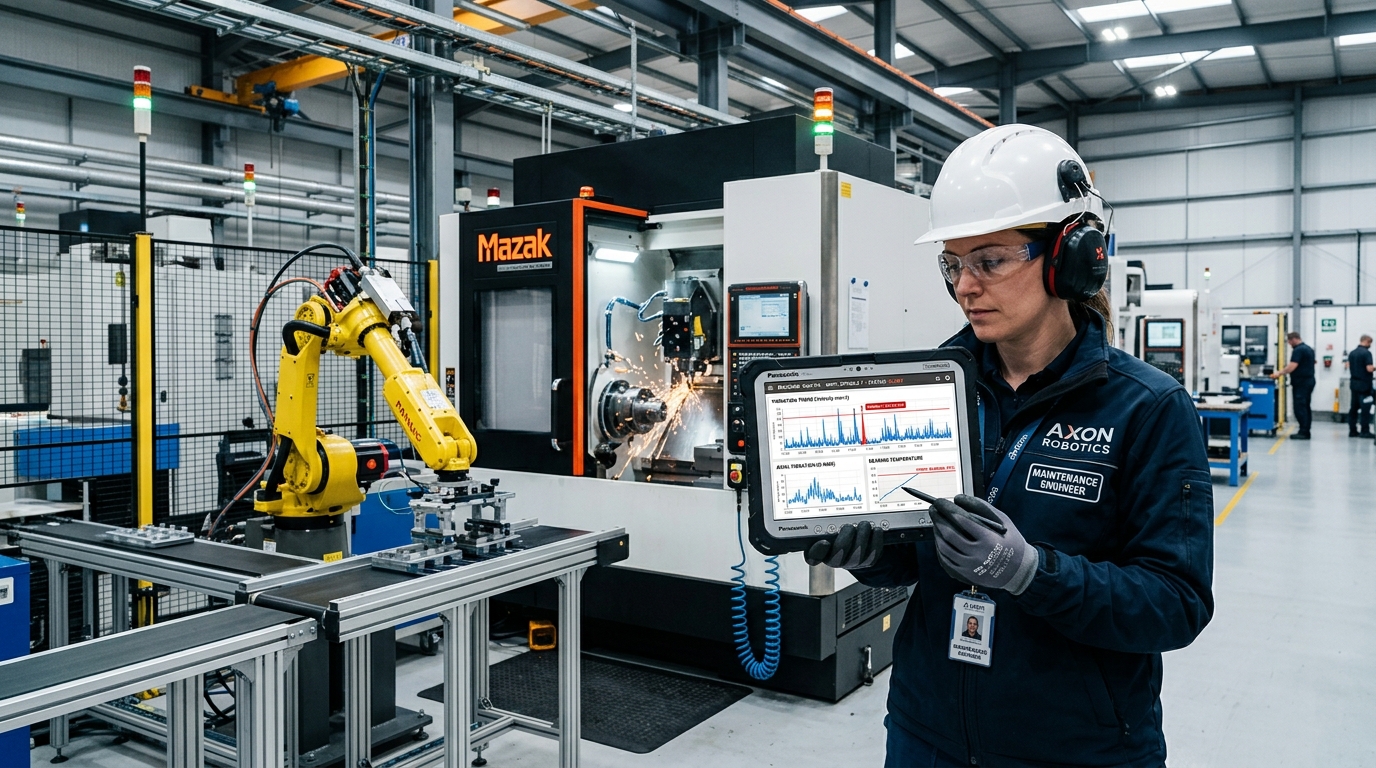
Key Operational Telemetry & Impact
3.5x - 5x
Maintenance ROI
Economic return from predictive condition-based maintenance vs run-to-failure
60 - 90 Days
Early Failure Warning
Advance notice of bearing and gearbox wear via vibration FFT trends
Zero Cloud Fees
Storage Overhead
On-premise high-density time-series historian with automatic downsampling
+38%
MTBF Improvement
Increase in Mean Time Between Failures through trend-based root cause fixes
1. The Trap of the Momentary Snapshot
Most industrial control panels show only current live values: the pump is running at 1,450 RPM, motor current is 42 Amperes, and bearing temperature is 68°C. To the operator on duty, these numbers appear within green normal limits. But without historical context, that reading is misleading.
Was the bearing temperature 52°C two weeks ago under identical ambient load? Has motor current steadily climbed 8% over the past month to overcome mechanical binding in the gearbox? A momentary snapshot cannot answer these questions; only high-resolution historical telemetry reveals the slope of degradation.
Industrial mechanical assets do not fail suddenly: 89% of failures exhibit progressive warning signatures (vibration, thermal, current draw) weeks before audible noise or seizure occurs.
2. The Role of the Industrial Time-Series Historian
Standard relational SQL databases struggle with the immense volume of industrial automation telemetry: a medium factory with 2,000 sensor tags sampled once per second generates 172 million data points every single day.
RockLyzor utilizes specialized industrial time-series historian architecture engineered for rapid sequential write throughput and loss-less compression algorithms. Decades of operational sensor history can be preserved in compact on-premise storage without sluggish query performance.
- Millisecond-accurate timestamping directly synchronized with plant NTP servers.
- High-speed deadband and swinging-door compression to minimize disk footprint while capturing critical transient spikes.
- Fast visualization queries rendering millions of historical points in sub-second browser charts.
3. Predictive Maintenance vs Calendar Routines
Traditional maintenance follows rigid calendar schedules: replace bearing lubrication every 90 days, overhaul gearbox every 12 months. This approach results in two major flaws: performing unnecessary overhauls on healthy equipment (introducing assembly errors), or failing to catch rapid premature wear before the scheduled date arrives.
Condition-Based Maintenance (CBM) leverages historical vibration velocity (RMS), peak acceleration, and bearing temperature trends. Maintenance is executed precisely when physical degradation thresholds are crossed, cutting routine maintenance labor by 30% while eliminating catastrophic run-to-failure breakdowns.
4. Multi-Variable Correlation: Finding the 'Why'
When a critical production machine produces defective output or trips on thermal overload, investigating a single sensor in isolation rarely reveals the true root cause.
Historical analytics allows engineers to overlay multiple telemetry channels on a synchronized timeline: motor winding temperature, line speed, ambient factory temperature, raw material batch IDs, and electrical supply voltage. In many cases, an elusive intermittent failure is discovered to correlate with a recurring voltage dip from an adjacent air compressor.
Historical multi-variable overlay eliminates finger-pointing between electrical, mechanical, and production teams by presenting indisputable physical evidence.
5. Long-Term Data Sovereignty & Storage Strategy
Many commercial cloud platforms charge escalating recurring fees for historical data retention, forcing factories to purge or downsample raw telemetry after 30 or 90 days. This destroys the multi-year baseline necessary for seasonal temperature comparisons and machine lifecycle analysis.
With RockLyzor's on-premise deployment, historical datasets remain inside the factory's private infrastructure indefinitely, providing an invaluable institutional memory that informs capital replacement decisions and continuous process optimization.
ENGINEERING FAQ
Frequently Asked Engineering Questions
How much disk space does industrial historical data require?
With modern time-series compression and deadband recording, 1,000 continuous sensor tags typically require less than 15 GB of local storage per year.
Can historical telemetry be exported for external analysis?
Yes. RockLyzor allows instant CSV, Parquet, and Excel exports, as well as programmatic REST API and ODBC/SQL connectors for ERP and data science teams.
What is the difference between live SCADA and a historian?
Live SCADA shows current operational states for immediate supervision; a historian logs and indexes every state change over months and years for trend analysis.
CONTINUE EXPLORING
Related Industrial Insights
Why Real-Time Industrial Monitoring Matters
How immediate visibility helps teams reduce response time, eliminate unrecorded micro-stoppages, and keep modern factory lines moving.
How Industrial Energy Monitoring Reduces Hidden Losses
Find consumption patterns, demand peaks, and utility penalties that traditional monthly utility invoices never reveal.
SCADA vs Traditional Industrial Monitoring
A practical technical comparison between centralized supervisory intelligence and isolated machine-level operator screens.
Start with your operation
Ready to See Your Factory Differently?
Discover how RockLyzor can centralize your industrial data and give your team real-time operational visibility.