
How Industrial Energy Monitoring Reduces Hidden Losses
Find consumption patterns, demand peaks, and utility penalties that traditional monthly utility invoices never reveal.
Salma Trabelsi
Energy Systems Engineer
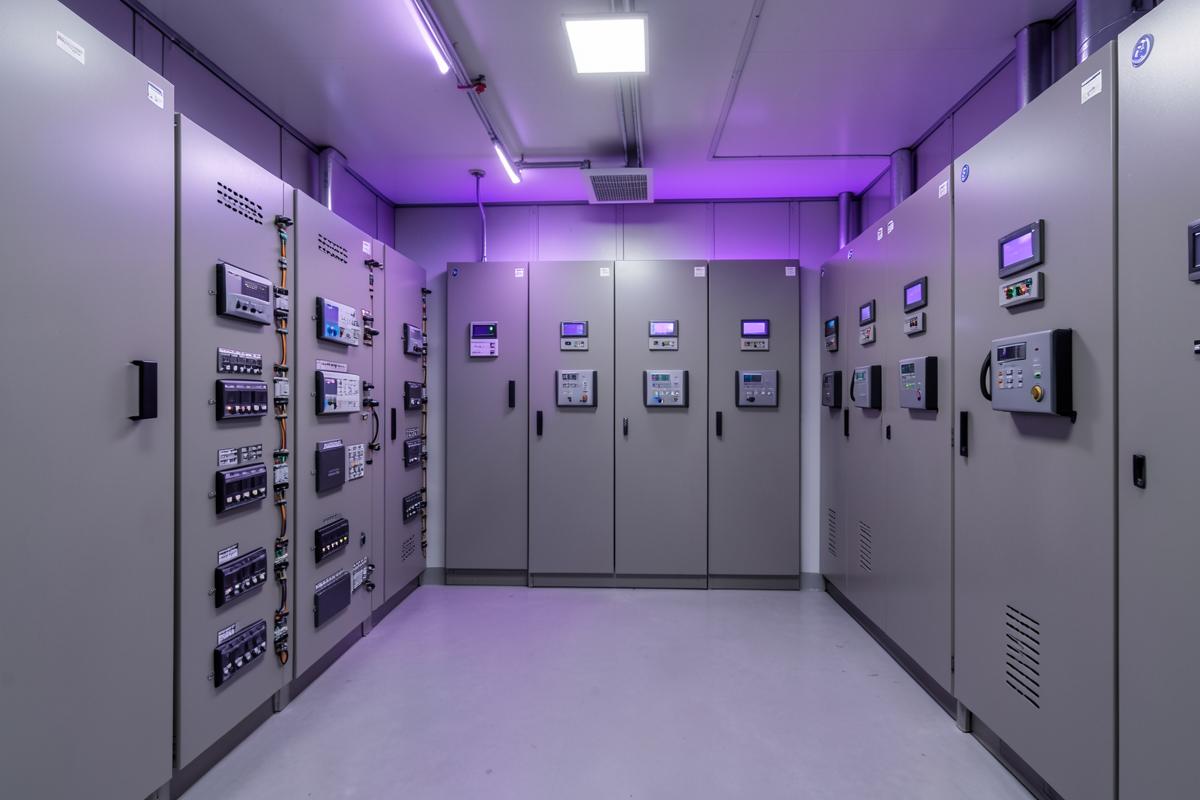
Key Operational Telemetry & Impact
18 - 25%
Energy Waste Reduction
Typical plant-wide savings after granular submetering implementation
Up to 30%
Compressed Air Losses
Share of air generation energy lost through undetected pipe leaks
15 min
Peak Demand Alerts
Predictive tariff window warnings before threshold penalties trigger
ISO 50001
Carbon Footprint
Audit-ready energy performance indicators (EnPIs) and compliance
1. The Monthly Utility Bill Illusion
Most factory managers treat electricity bills as fixed overhead costs. Once a month, the utility invoice arrives showing total kilowatt-hours (kWh) consumed and peak kilovolt-ampere (kVA) demand. By that point, the money is gone, and the bill offers zero insight into which machine, shift, or process was responsible for the expense.
Without continuous submetering, energy waste remains completely hidden inside the aggregated total. Facilities routinely pay thousands of dollars in avoidable utility surcharges caused by overlapping high-power motor start-ups, uncorrected power factor penalties, or auxiliary equipment running empty across weekend shifts.
An unmonitored industrial plant typically consumes between 18% and 35% of its peak energy baseline during hours when zero production is actually taking place.
2. Granular Submetering Architecture
True energy intelligence requires breaking down the main incoming feeder into dedicated functional zones. In accordance with ISO 50001 Energy Management standards, energy must be attributed to Specific Energy Consumption (SEC) metrics—such as kilowatt-hours per ton of product or kWh per machined unit.
By installing digital multi-function power meters across major distribution panels and connecting them via Modbus RS-485 or Ethernet, RockLyzor tracks real-time voltage, current, active power (kW), reactive power (kVAR), and apparent power (kVA) every second.
- Isolates heavy consumers: induction furnaces, high-pressure compressors, chillers, and hydraulic packs.
- Compares energy efficiency across identical machine cells to spot mechanical binding or motor degradation.
- Automatically aggregates energy costs per production batch for accurate product margin accounting.
3. Eliminating Phantom Baseloads
One of the fastest returns in energy monitoring comes from investigating non-productive operational periods. When production halts on Friday evening, plant baseline power draw should plummet to a minimal standby level.
In practice, continuous energy graphs frequently reveal cooling fans, hydraulic recirculation pumps, conveyors, and lighting banks left energized throughout the entire weekend. By establishing automated night-shift and weekend threshold alarms, facilities eliminate thousands of wasted kilowatt-hours every single month.
4. Managing 15-Minute Peak Demand Windows
Industrial utility contracts heavily penalize facilities for sharp spikes in energy consumption, typically calculated over rolling 15-minute integration windows. A single 10-minute demand surge can dictate peak capacity charges for an entire billing quarter.
RockLyzor calculates predictive sliding-window demand in real time. When total plant power approaches contracted peak limits, automated notifications warn operations teams or trigger automated non-critical load shedding (e.g. staggering wastewater pumps or chiller start times).
Smoothing just two major peak demand spikes per month can reduce monthly electrical expenditures by 12% to 20% without impacting production schedules.
5. Optimizing Compressed Air & Chillers
Compressed air is the most expensive utility in a modern factory: only about 10% to 15% of electrical energy input is converted into usable pneumatic energy. The remaining 85% is lost as heat and air leaks.
By correlating electrical energy consumption of air compressors with flow rate sensors and pressure transmitters, RockLyzor quantifies the exact financial cost of compressed air leakage. When a compressor cycles repeatedly during a scheduled maintenance shutdown, the system calculates the exact cubic meters of compressed air escaping through cracked fittings.
ENGINEERING FAQ
Frequently Asked Engineering Questions
What hardware is required for industrial energy submetering?
Standard Class 0.5S or Class 0.2S multi-function digital power meters equipped with split-core or Rogowski current transformers (CTs), communicating over Modbus RTU/TCP.
Does submetering require shutting down plant power?
No. Split-core current transformers can be safely clamped around existing busbars and cables without disconnecting live industrial electrical feeders.
How does RockLyzor support ISO 50001 certification?
The platform generates automated Energy Baselines (EnBs), Energy Performance Indicators (EnPIs), and regression models required for ISO 50001 audits.
CONTINUE EXPLORING
Related Industrial Insights
Why Real-Time Industrial Monitoring Matters
How immediate visibility helps teams reduce response time, eliminate unrecorded micro-stoppages, and keep modern factory lines moving.
SCADA vs Traditional Industrial Monitoring
A practical technical comparison between centralized supervisory intelligence and isolated machine-level operator screens.
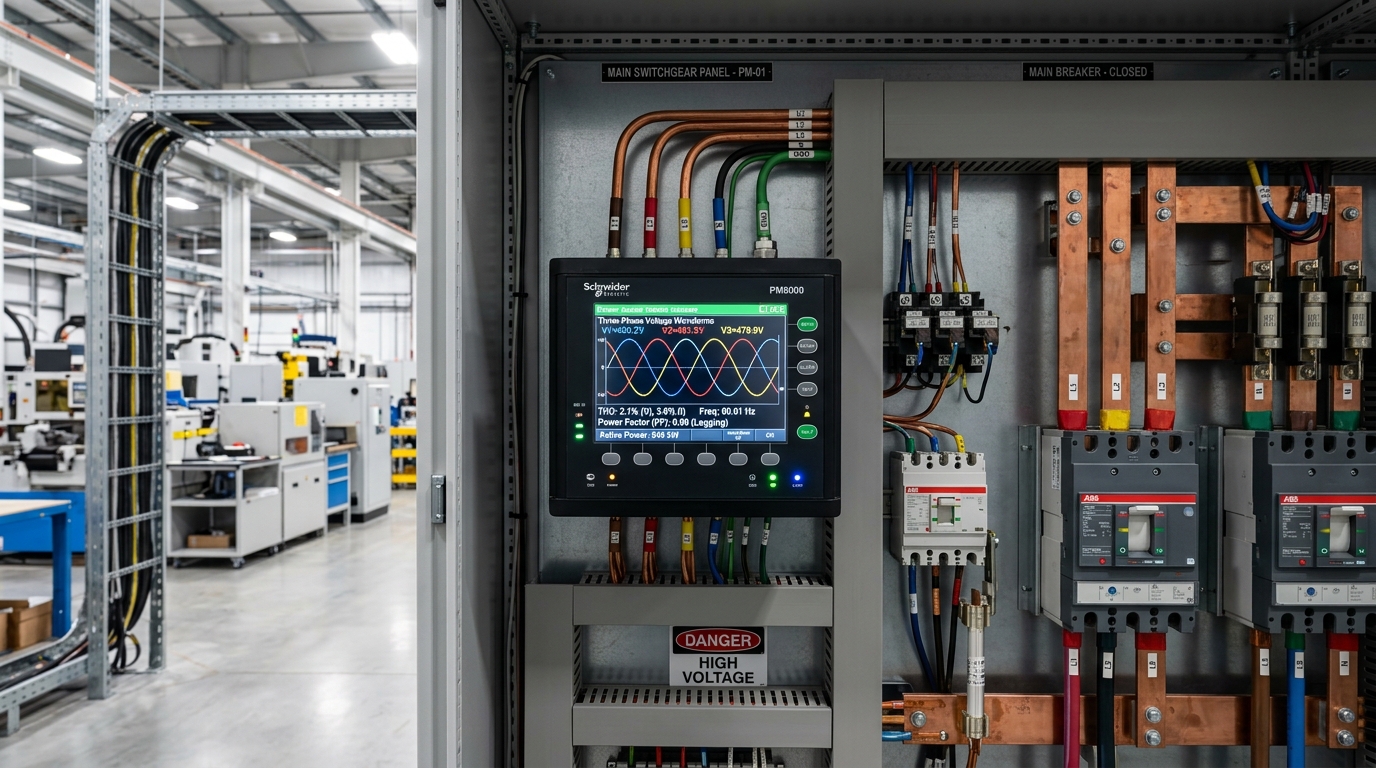
Understanding Power Quality in Industrial Facilities
The essential electrical indicators behind reliable equipment health, harmonic mitigation, and electrical switchgear resilience.
Start with your operation
Ready to See Your Factory Differently?
Discover how RockLyzor can centralize your industrial data and give your team real-time operational visibility.